Data · North vs SouthSame people · same language · split in 1945
North Korea vs South Korea
Same people, same language, same food. In 1945 the peninsula was cut in two along the 38th parallel, and for a while the two halves were roughly even (in 1990 people in both lived about 70 years). Then they split apart. These charts show how far.
The gap in eight numbers
Before the split, the north was the richer half
Japan built its factories, mines and dams in the north, so in 1940 the northern half made about $2,624 per person and the south about $1,975. That flipped fast after the war.
By 2022 the South was at $41,321 and the North at $1,569, about 26 times less. Nobody has real numbers for North Korea between 1944 and 1989 (it publishes almost nothing), which is why its line has a hole.
GDP per person
Average yearly income per person, adjusted for prices and inflation (2011 international dollars).
Neck and neck until the famine
In 1990 a baby in the North could expect to live 70.5 years, in the South 71. Basically the same. Then the Soviet Union collapsed, the aid stopped, floods hit, and the famine of the mid 1990s killed somewhere between several hundred thousand and a few million people.
The UN estimate drops to 60.8 years in 1995. Today it is 73.6 years in the North and 84.3 in the South, so people in the North die about 10.7 years earlier. (The flat stretch after 1995 is how the UN models the crisis years. Nobody knows the real year-by-year path.)
Life expectancy
How many years a baby born that year would live on average.
Children paid for the famine first
In 1990 about 4.1% of children in the North died before turning five. By 1996 it was 10.6%, one in ten.
It has come down a lot since then, to 1.7% in 2024. That is still about 6 times the South's rate (0.3%).
Children who die before age five
Share of newborns who do not reach their fifth birthday.
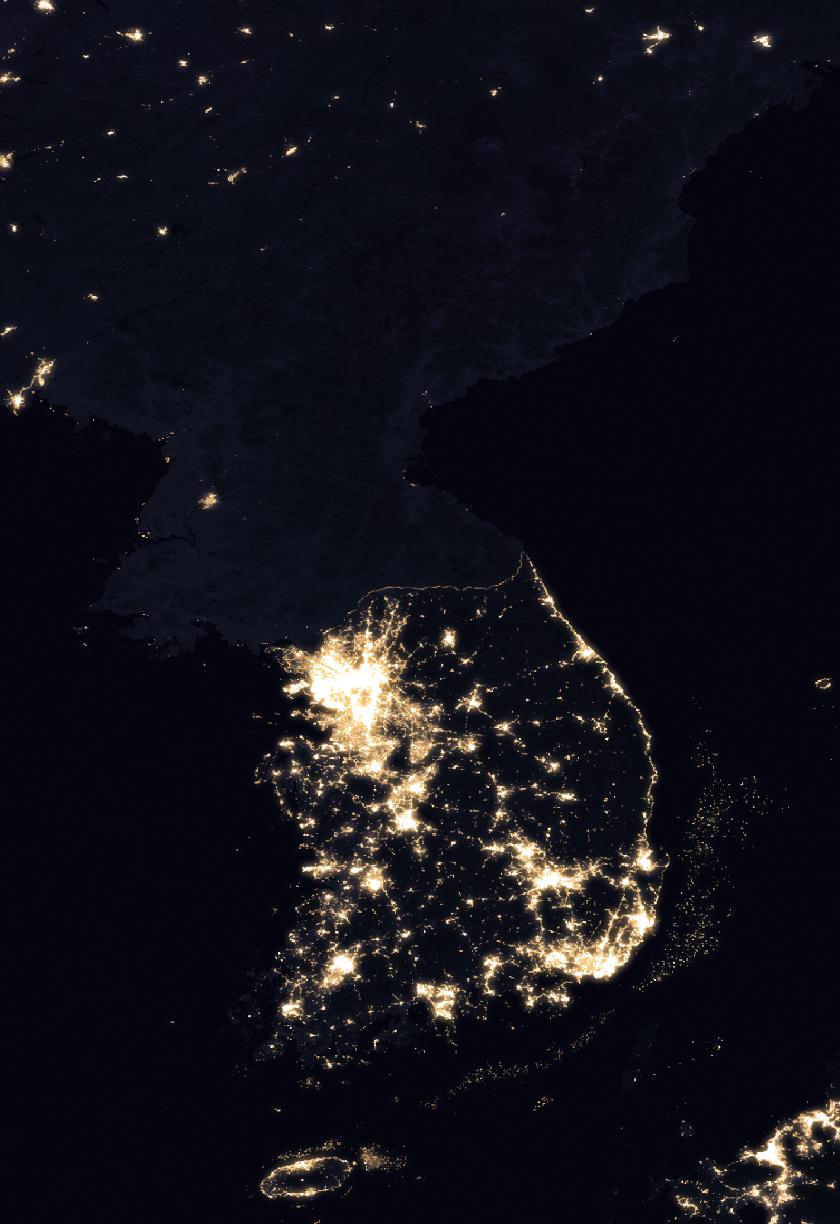
The lights went out and never came back
North Korea used more energy per person in 1980 (15,083 kWh) than it does now (7,301 kWh). It is one of very few countries that went backwards. The South went from 11,823 to 69,745 kWh over the same years.
That is the photo above. About 61% of North Koreans have electricity at home, and even for them it is often a few hours a day.
Energy use per person
All energy used in a year (power, heat, transport), divided by the population.
The South grew taller
Men born in 1930 were the same height on both sides: 164.4 cm in the North, 164.8 cm in the South. Men born in 1996 were 172 cm in the North and 174.9 cm in the South.
Height mostly comes down to food and health in childhood. The same people drifting 2.9 cm apart in a few decades is a record of hunger. Women show the same gap (159 vs 162.3 cm).
The South was a dictatorship too, then it changed
People forget this, but South Korea was run by military strongmen until 1987. Then mass protests forced free elections and its democracy score jumped from 0.31 to 0.62 in two years.
North Korea's score has sat near zero for 80 years (0.08 in 2025, on a 0 to 1 scale). Same people, different system. That is probably the most important chart here.
People still leave, at great risk
32,548 North Koreans reached South Korea between 2002 and 2025, and 75% of them were women. The busiest year was 2009, with 2,914 arrivals.
Arrivals fell after 2011, the year Kim Jong Un took power, and almost stopped when North Korea sealed its border for COVID in 2020 (63 people in 2021). In 2025, 224 people made it.
North Koreans reaching South Korea
People who escaped and arrived in South Korea each year, by sex.
More comparisons
Hover or tap a chart to see the numbers, click a country to hide it. Every chart has a full page with a table and a CSV.
Food per person per day
Calories available per person per day. Around 2,100 kcal is the usual minimum.
Access to electricity
Share of people who have electricity at home.
Mobile phone subscriptions
Subscriptions per 100 people. Above 100 means some people have more than one.
Children per woman
Average number of children a woman has over her life, at that year’s rates.
Soldiers
Active armed forces personnel.
CO₂ emissions per person
Tonnes of carbon dioxide from fuel and industry, per person. A rough measure of how much industry runs.
Population
People living in the country.
Average height of women
Adult height by the year they were born.
How much can you trust North Korea numbers?
Less than for almost any other country. North Korea stopped publishing most statistics decades ago, so most of these are estimates by outsiders (the UN, the Bank of Korea, FAO), built from satellite images, trade data, defector interviews and the two censuses the regime allowed (1993 and 2008).
So read them as the best guess available, not as exact counts. Where an estimate is especially shaky we say so under the chart. Every chart links to its source.
Quick answers
How much richer is South Korea than North Korea?
About 26 times per person. In 2022 GDP per person was about $41,321 in South Korea and $1,569 in North Korea (Maddison Project estimates, 2011 dollars).
Do South Koreans live longer than North Koreans?
Yes, about 10.7 years longer. UN estimates for 2023 are 84.3 years in South Korea and 73.6 in North Korea. In 1990 the two were almost equal, around 70 years.
Were North and South Korea ever equal?
Roughly, yes. In 1940 the industrial north was richer per person than the south, and in 1990 life expectancy was about the same in both. The big gaps opened after the 1990s famine and as the South industrialised and became a democracy.
Are North Koreans shorter than South Koreans?
On average, yes. Men born in 1930 in both Koreas were about the same height (164.4 cm vs 164.8 cm), but men born in 1996 average 172 cm in the North and 174.9 cm in the South, according to NCD-RisC estimates. Studies of defectors measured bigger gaps for children who grew up during the famine.
Use the data
Every number here is in our open dataset, updated weekly, with the original source on each series. Download it, check it, build on it.